Typically, electric vehicle drivers try to do something good for the environment and to pollute the atmosphere as little as possible. Even though electric cars tend to produce less carbon pollution than gas vehicles, hearing that charging an electric vehicle also pollutes CO2 concerns a lot of potential EV users. But how green are electric cars compared to fuel vehicles?
Electric cars vs. gas-fuelled vehicles’ carbon footprint
To answer the question “How much CO2 is saved by driving an EV”, we can compare this number with the gCO2/km polluted by a similar fuel-driven car.
To make it easier for you, we have a calculator doing just that for the different countries. And thereby helping you, to get a feeling for the size of your carbon footprint and how it could change when driving an electric vehicle.
Use our carbon footprint calculator to calculate the CO2 consumption for different countries.
1. Distance unit:
2. Model energy consumption kWh/100
3. Average yearly distance
4. Enter the CO2 of the compared fuel vehicle emission in g/
5. Countries CO2 emission: kg CO2/kWh
Estimated yearly CO2 savings: kg
Estimated monthly CO2 savings: kg
Estimated daily CO2 savings: g

Sources of electric cars’ carbon emissions
We can identify two main sources of carbon emissions during the life cycle of an EV:
- The energy needed to produce the car itself, and especially the battery.
- The energy used to produce electricity to charge the vehicle.
Understanding electric vehicles’ CO2 emissions
The answer to the question, of how much CO2 is emitted, depends on the country you are charging your car in. The CO2 amount depends on the CO2 emitted for the electrical energy, which is charged by the driver. If the driver charges in a country with a high amount of renewable energy like wind, solar or hydro energy (e.g. Norway), his or her charge leads to less CO2 pollution than in a country, which depends on a high percentage of coal plants for example.
The diagram shows an example of the diversification of the energy supply for a country. The grey energy sources (Biomass, Mineral Oil, Natural Gas, Hard Coal, Lignite) are sources, that pollute CO2. The diversification applies for the average kWh over a year. In this example, circa half of the produced energy does not pollute the atmosphere with CO2 (Hydro Power, Wind Off- and Onshore Power and Solar Power). We highlighted Nuclear Power in yellow, because it does not pollute the atmosphere with CO2 but comes with other downsides concerning many EV drivers.
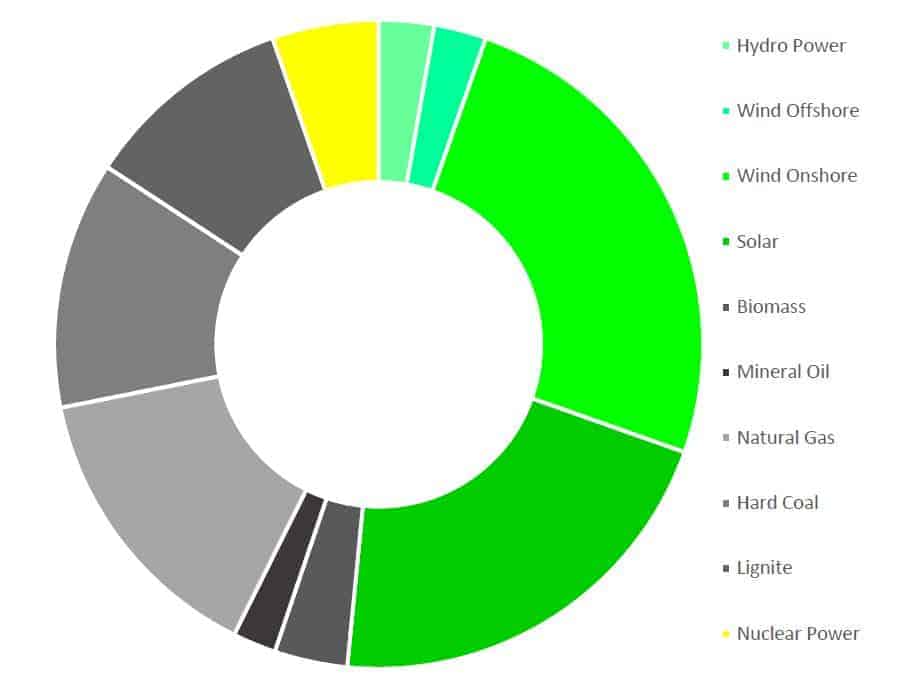
Among the energy sources that pollute CO2, the sources differ in regard to the amount of polluted CO2 per kWh. This is shown by the outer circle in the following diagram. We can see for example, that coal plants pollute more CO2 per kWh than Natural Gas plants.

The following table gives the CO2 pollution for each energy source.
| Source | CO2 kg/kWh |
|---|---|
| Hydro Power | 0 |
| Wind Offshore | 0 |
| Wind Onshore | 0 |
| Solar | 0 |
| Biomass | 0.20 |
| Mineral Oil | 0.26 |
| Natural Gas | 0.20 |
| Hard Coal | 0.34 |
| Lignite | 0.36 |
| Nuclear Power | 0 |
In the example, we chose for the diagrams, the overall CO2 pollution for the average kWh is 127 gCO2/kWh. This average can be taken into account when you want to calculate the amount of gCO2/km.
An effect we do not consider in our carbon footprint calculator is programmable home charging stations. Charging stations that can be programmed regarding the charging time can impact the electrical grid. By balancing the charging times, many charging stations can be orchestrated in a manner that balances the energy consumption in the electrical grid. At times, in which solar or wind energy is produced and pushed to the grid, the electricity is cheaper and charging stations can be set to charge at this specific time. By doing this, the EVs enable a higher amount of renewable energy in the energy grid. Enabling more renewable energy in the grid EVs positively affects countrywide electricity production, reducing the carbon footprint even more.
A study from the Alternative Fuel Department Center of the U.S. Department of Energy highlights the impact of the energy mix on the emission of EVs compared to PHEVs and combustion vehicles. One major takeaway is the impact of charging at the workplace, by allowing the drivers to charge during work, the percentage of electric miles driven is increased and thereby the overall emission is decreased. In our examples, we assume, that all miles are either driven electric or with a regular combustion engine.
Now that we understand which energy sources produce CO2 emissions, we can compare both electric cars and gas-powered vehicles’ carbon footprint.
CO2 emissions produced during the production of an electric vehicle
During the production of each car, CO2 is set free, by using energy for steel production, the energy for the production tools, etc. Moreover, rare earth metals that compose the batteries are used in the manufacturing process of electric vehicles. Their extraction also contributes to carbon emissions. In our calculator, we focus on the CO2 emitted during driving. But you should also take into account the carbon emissions produced during the production of the EV.
The impact of CO2 on the climate
CO2 is a gas that leads to the greenhouse effect. The greenhouse effect describes the sealing of the warmth of the earth and atmosphere by gases and leading to the rising temperature of the climate. Governments around the world are implementing policies in order to switch from polluting energies to renewable energies. Moreover, many of them are already planning to replace completely fuel cars by EVs in the future to reach their CO2 goals. It will take time, but we will probably get there one day.
Other gases emitted by electric cars
With our carbon footprint calculator, we focus on the emission of CO2 since it has the highest rate of greenhouse gases. To understand the full impact on the climate, we should also keep in mind that fuel-driven vehicles also emit other gases:
- carbon monoxide-CO
- hydrocarbons-HC
- particulate matter-PM
- nitrogen oxides-NOx
Living quality in big urban areas
Besides the carbon footprint, the potential effect of EVs on the environment can be seen in big urban areas.
The air quality in huge cities is often miserable due to pollution from vehicles. Fine dust limits are reached regularly in many parts of the world. The fine dust affects the vision and leads to health issues for the population.
Reducing the direct pollution in the city may by EVs lead to a higher living quality in cities.
Noise pollution
Electric engines are a lot less noisy than combustion engines, leading not only to a quiet driving experience but also reducing the noise of cars in the streets. EVs have the potential to reduce noise pollution. Another argument, why EVs might increase the living quality in cities.
We hope you find this article helpful. If you have any questions, please don’t hesitate to contact us at contact@homechargingstaions.com.